Garmin Year In Review: Insights From 2024
We wear our Garmin watches year-round at The Running Channel and we’re often comparing sleep scores and training readiness, wondering whether we really could hit that 5km prediction time, and high fiving for a one-up to our VO2 Max score.
But what does 2024 look like for Garmin users around the world? We look at the numbers in the Garmin Connect End Of Year Report.
WE AVERAGE 71 FOR BODY BATTERY
Body Battery is a prediction of your personal energy level based on all your activities, plus sleep, rest and stress – the higher the number (out of 100), the more your battery is ‘charged’.
The average high is 71, which we’ll read when we wake up in the morning. The average low at the end of the day is 22, and that means the average drain on Body Battery is 49.
The Netherlands had the highest average Body Battery high of 74, with Japanese users averaging 66 as the lowest average.
Globally, the day with the lowest Body Battery score is, perhaps unsurprisingly, 1 January.
The day of the year where we globally expended the most energy was Tuesday 27 August. We have no idea why!
How can you improve your Body Battery? Balance times of activity with rest, and do your best to get a good sleep.
HOW DID YOU SLEEP?
The average sleep score was 71, which Garmin categorises as Fair. That means we could all do with getting a better sleep, which will help our recovery and readiness for the day’s activities.
We get our best sleep on a Monday night, and our worst sleep on a Saturday.
You can probably guess our worst sleep of the year: 31 December. The average sleep score that night is just 58.
The Netherlands are the best sleepers overall, while Indonesia comes bottom of the Sleep Score table with an average of 64.
ARE YOU STRESSED?
Stress is a physiological response to the things we face in life, whether that’s stress from work or home life, or feeling stresses that come from hard exercise, bad sleep, one-too-many coffees, or being ill. It all combines as stress that our body has to try and deal with.
Stress is measured by a Garmin based on heart rate and heart rate variability, and how those things change through the day and night. Low stress is a good sign of better balance between periods of intensity and calm.
Measured as 1-100, the average stress score is 30, which Garmin categorises as low, so overall we’re all doing pretty well.
Monday is the day on which we feel least stressed, and on Saturday we feel the most stress.
What was the most stressful day of 2024 for Garmin users? It was Saturday 21 September. What were you doing that day? The least stressful day was 2 January, so we collectively found a way to chill out after a busy Christmas and New Year.
The most stressful nation? Malaysians averaged 33, while the least stressed were South Koreans who averaged 28.
HOW READY ARE YOU TO TRAIN?
Your training readiness score is a measure taken from things like your recent activities, your sleep score, heart rate variability and stress, to let you know how primed you are for your next activity. Low training readiness is a sign that you need a little more rest, or to take it easy for a day.
The average global training readiness score was 60 in 2024, which Garmin puts in the moderate category.
We have our highest training readiness on Tuesdays, and our lowest on Sundays.
It’ll be no surprise that the lowest day for training readiness was 1 January, and the highest was 23 April.
New Zealand has the highest training readiness average of 64, and South Korea has the lowest average of 51.
WHAT’S YOUR STATUS?
Based on your current load of training, your Garmin gives you a training status, which could be: Peaking, Productive, Maintaining, Strained, Unproductive, Overreaching, Recovery or Detraining.
It’s a sign of whether you’re progressing, or at risk of pushing yourself too hard – or could even push yourself a little harder.
Our readiness seems to be seasonal: Detraining statuses were most common in October, November and December. Overtraining was most common in January. Peaking and Productive statuses were most common in June, July, August and September, perfect for your autumn races.
GET YOUR STEPS IN
The average number of steps taken by a Garmin user is 8,317. Hong Kong averages the most with 10,340 and users in Indonesia average the least with 5,375. Are you an above-average daily stepper?
WHAT ACTIVITIES ARE WE DOING MORE OF?
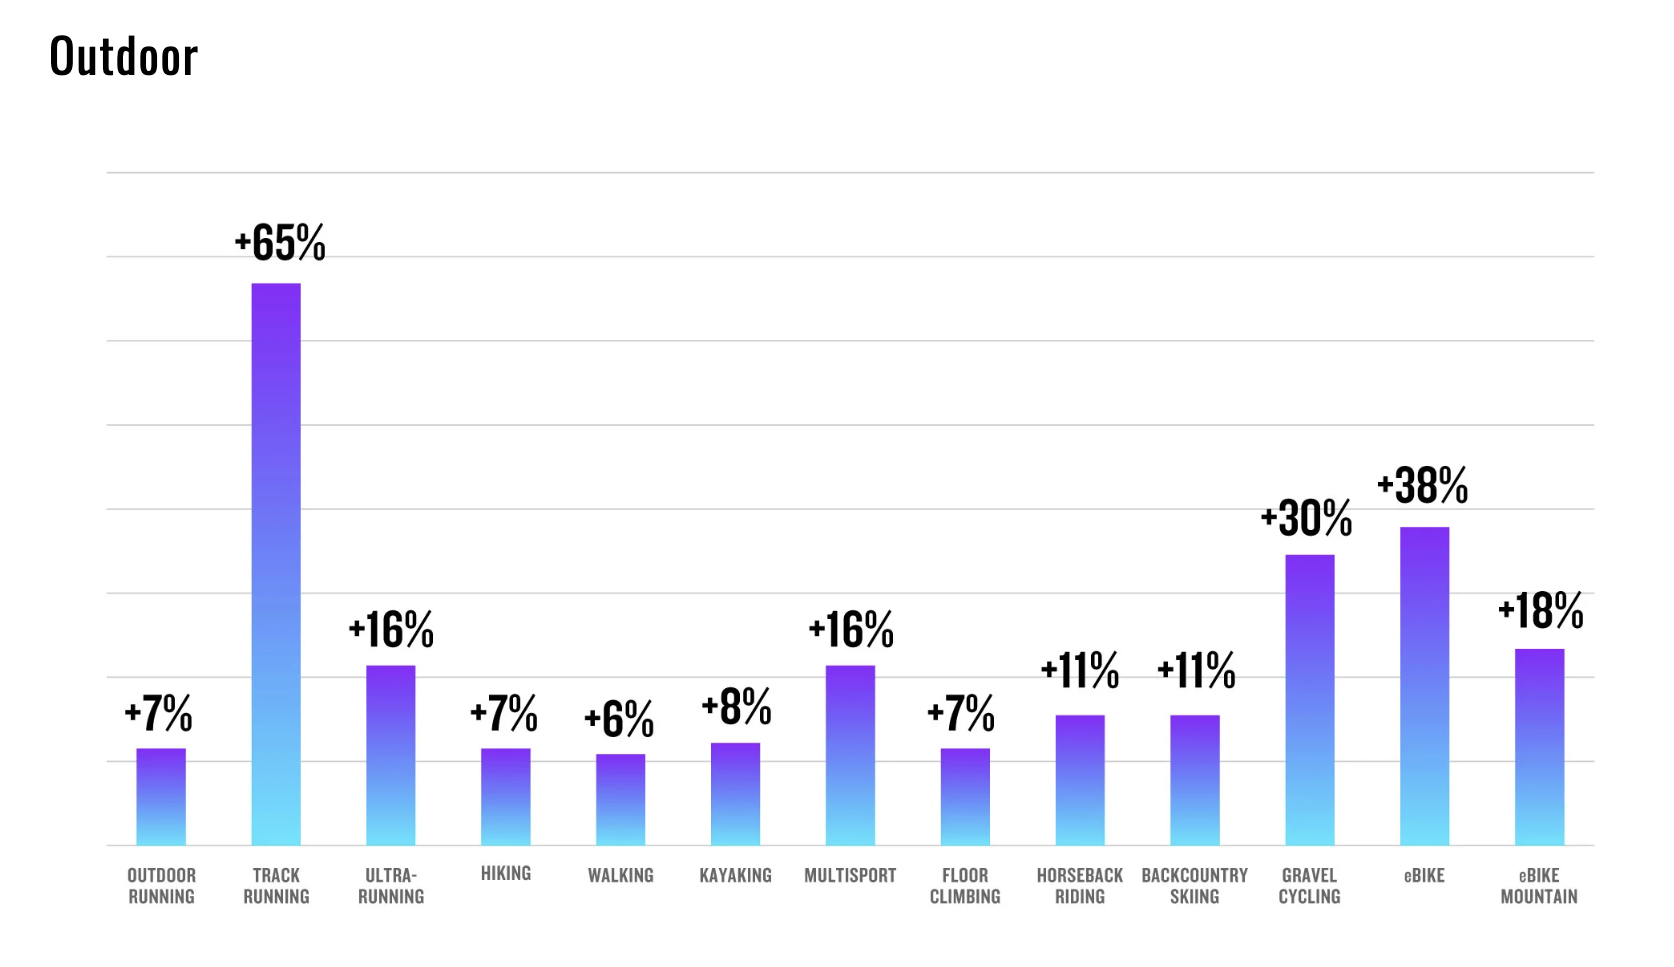
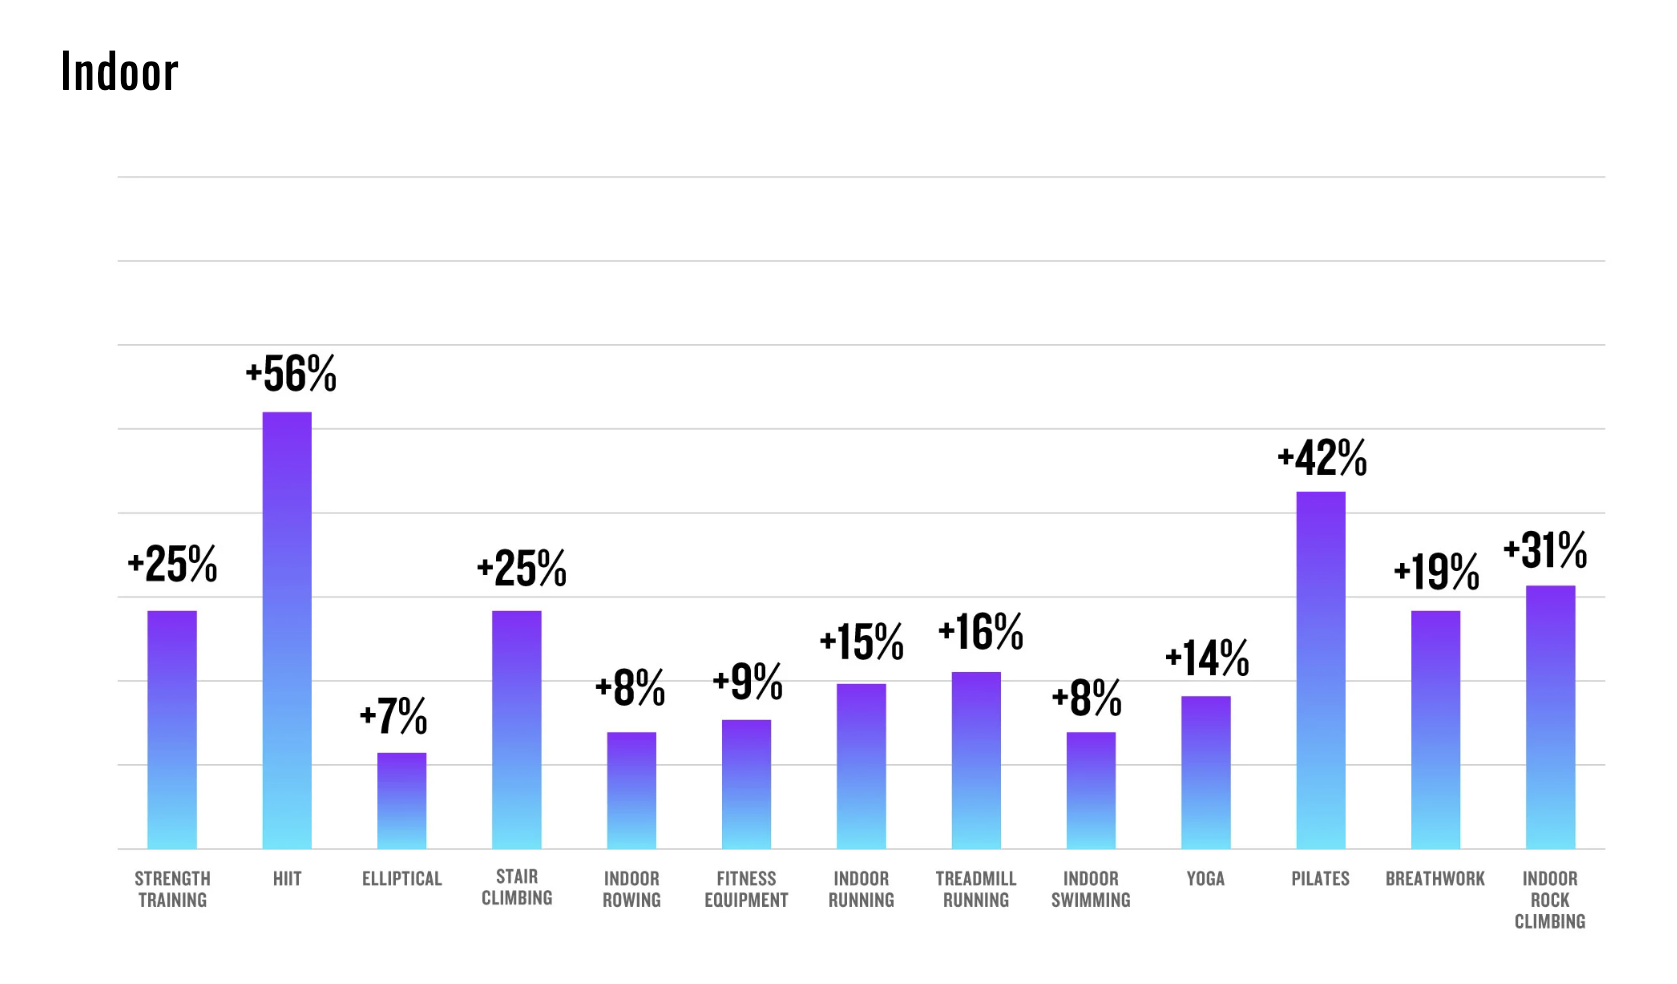
Below are the outdoor and indoor activities that more of us did in 2024. Track running saw a big increase, as did HIIT and pilates. And how about that 16% increase in ultrarunning? Not only are more of us going faster on the track, we’re also going further outside!



















Running News
Ingebrigtsen Stars at World Athletics Indoor Championships 2025 – Plus All The Winners!
Sam Ruthe Is First 15-Year-Old To Run A Four-Minute Mile!
Eliud Kipchoge Will Run The 2025 Sydney Marathon!