What Is The Average Marathon Finish Time?
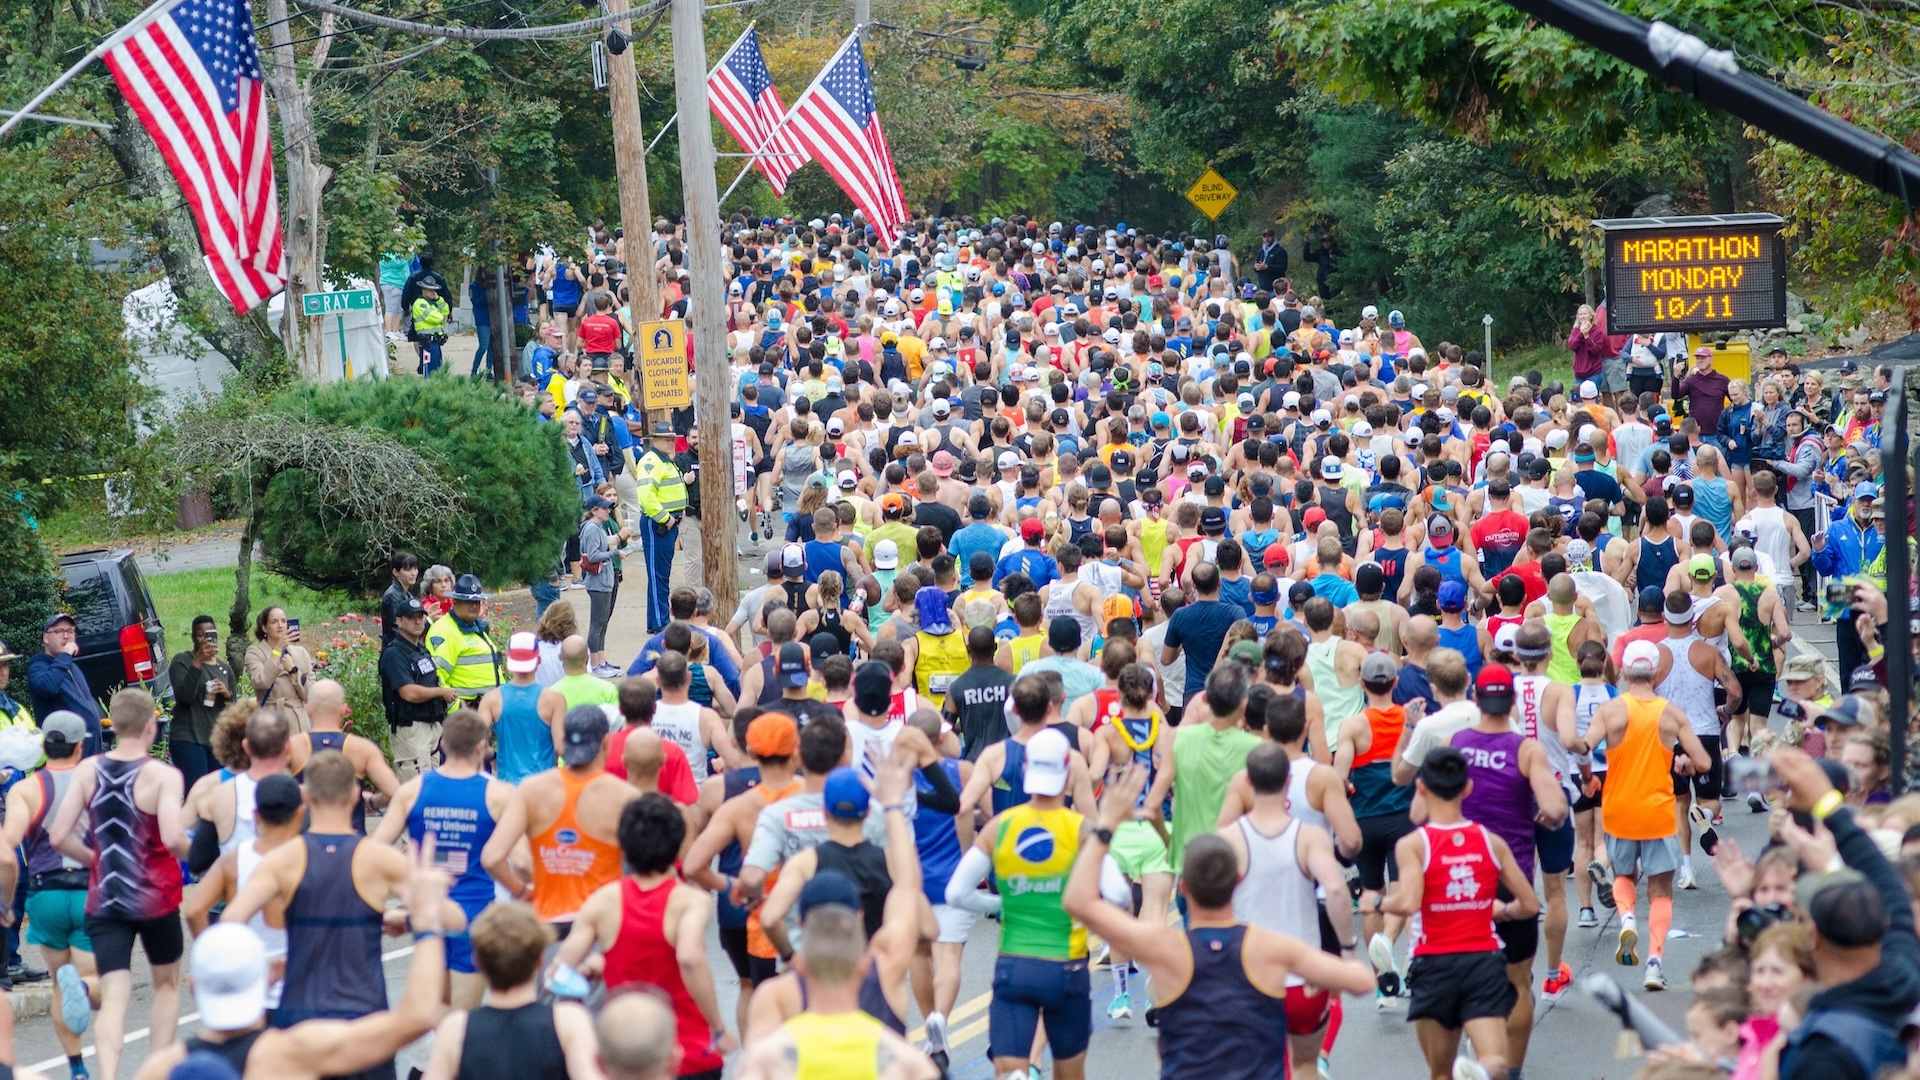
Well over a million people complete a marathon every year, and in 2024 we’ve seen the three biggest marathons ever, plus over 250,000 people ran the Marathon Majors. As marathons continue to get more popular, we wanted to see what the average finish time is for someone running a marathon.
We’ve analysed dozens of races to look at how long it takes people to run a marathon. While we haven’t looked at every result from every marathon, we’ve taken a broad sample of the biggest road races around the world, and the numbers we see are pretty consistent.
From those results we can say that around 4:15-4:20 is the general average time that it takes to run a road marathon (based on the mathematical average). That’s just over six minutes per kilometre or just under 10 minutes per mile.
Men tend to average slightly faster (closer to 4:00) and women are slightly slower (closer to 4:30). But there’s a lot more complexity behind these numbers…
In this we’re going to look at:
- There’s nothing average about finishing a marathon!
- Average marathon finish times around the world
- Average Six Star finisher time
- Sub-3 Hours vs Over-5 Hours at major races
- Age analysis of Manchester Marathon finishers
- Marathon pace guide
THERE’S NOTHING AVERAGE ABOUT FINISHING A MARATHON!
Whatever your time, finishing a marathon is an incredible achievement, and there’s nothing average about it!
Whatever your goal, there will be others around you in a marathon who are at a similar pace to you. If that’s five hours, six hours, seven hours, you’ll have others to run with. In fact, as we’ll see, in almost all marathons, there are more runners who finish in over five hours than under three hours.
Finish times are all relative; some runners will be disappointed to run 2:30, others will be delighted to finish in seven hours. With such a wide spread of finish times, it makes it difficult to figure out an ‘average’ time that’s more meaningful than just the simplest mathematical sum.
Based on your training, you should have an idea of the time you expect your marathon to take you. It’s important to be realistic about that as you begin your race. We’ve got a pace guide at the end of this page to help show what running paces mean for different marathon finish times.
AVERAGE MARATHON FINISH TIMES
We will look into some of these races in more detail, but based on available data, these are mathematical average finish times from some popular road marathons around the world. They include some of the marathon majors and also larger regional city races. All are road runs, not trail races.
In general (and where the data is available), the median finish time is typically close to the average time.
It’s these results, plus many others, which have led us to say that 4:15-4:20 is a general mathematical average finish time for a marathon.
| RACE | FINISHERS | OVERALL AVERAGE | MALE | FEMALE / NON-BINARY |
| London Marathon 2024 | 53,980 | 4:27:30 | 04:11:38 | 4:49:22 / 4:41:00 |
| Chicago Marathon 2024 | 52,150 | 4:20:01 | 4:04:03 | 4:35:03 / 4:38:07 |
| New York City Marathon 2024 | 55,646 | 4:31:31 | 4:17:47 | 4:48:31 / 4:41:49 |
| Boston Marathon 2024 | 25,554 | 3:53:05 | 3:43:59 | 4:05:17 / 3:40:31 |
| Manchester Marathon 2024 | 21,825 | 4:13:51 | 4:03:21 | 4:37:41 |
| Grandma’s Marathon 2024 | 7,556 | 4:15:40 | 4:03:39 | 4:32:20 |
| Twin Cities Marathon 2024 | 6,798 | 4:20:32 | 4:12:55 | 4:33:55 |
| Cologne Marathon 2024 | 5,638 | 4:05:12 | 4:00:51 | 4:20:00 |
| California International Marathon 2023 | 9,183 | 3:58:37 | ||
| Houston Marathon 2024 | 7,164 | 4:13:23 | ||
| Los Angeles Marathon 2024 | 20,450 | 5:31:23 | ||
| Marine Corps Marathon 2024 | 16,180 | 4:36:39 | ||
| Philadelphia Marathon 2024 | 11,439 | 4:15:12 | ||
| Brighton Marathon 2024 | 11,291 | 4:30:23 | ||
| Dublin Marathon 2024 | 17,723 | 4:11:05 | ||
| Milan Marathon 2024 | 6,921 | 3:59:25 | ||
| Sydney Marathon 2024 | 20,272 | 4:17:11 | ||
| Melbourne Marathon 2024 | 8,489 | 4:01:10 |
The average from the Los Angeles Marathon looks like an outlier in this list, but looking at 20 years of results, this time is consistent with the general average for that race.
The Boston Marathon has the fastest average of all the large races and this is because around 80% of people in the race have achieved a qualifying time, already making them among the faster runners in their age category.
We do not have full data for the Valencia Marathon, but it seems like the median finish in 2023 was around 3:35. Based on this, and the data we looked at in our piece about the world’s fastest marathons, it looks like Valencia would be the marathon with the fastest average finish time in the world.
THE AVERAGE SIX STAR FINISHER TIME
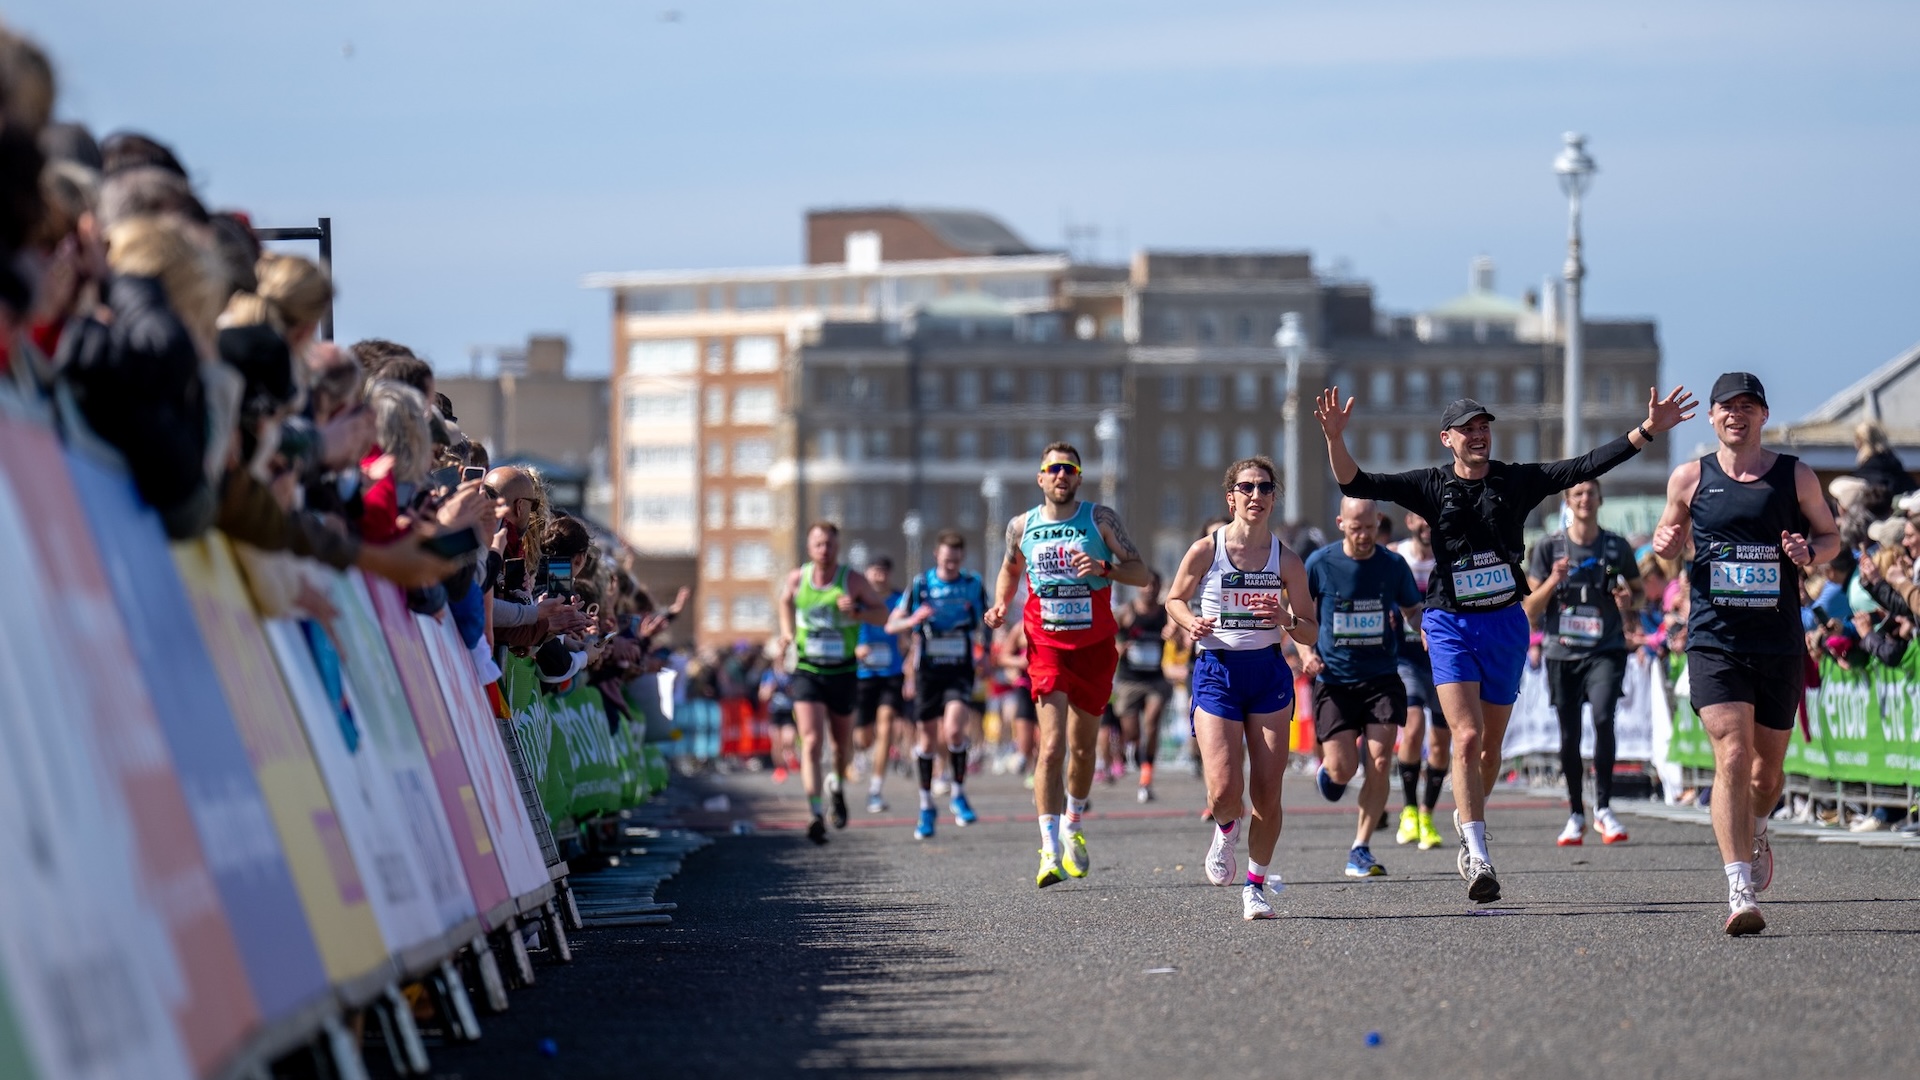
Abbott World Marathon Majors tell us the average marathon time for a six star finisher in 2024 was 4:03:05.
SUB-3 HOURS VS OVER-5 HOURS AT MAJOR RACES
While most marathons come out with a similar average time, that doesn’t reflect the spread of times being run. So we thought we’d look at how many people finish in under three hours compared to over five hours – in almost all marathons, there are many more people who run for over five hours.
| Sub-3 | 3-4 Hours | 4-5 Hours | 5+ Hours | |
| London Marathon 2024 | 3,747 (6.9%) | 17,294 (32.1%) | 17,930 (33.2%) | 15,009 (27.8%) |
| Berlin Marathon 2024 | 4,204 (7.8%) | 22,125 (40.9%) | 18,701 (34.6%) | 9,030 (16.7%) |
| Chicago Marathon 2024 | 3,356 (6.4%) | NA | NA | 12,289 (23.6%) |
| Tokyo Marathon 2024 | 1,130 (5.1%) | 9,277 (26.2%) | 10,844 (30.6%) | 13,508 (38.1%) |
| Boston Marathon 2024 | 2,886 (11.3%) | 13,329 (52.2%) | 6,530 (25.6%) | 2,785 (10.9%) |
| Manchester Marathon 2024 | 1,121 (5.1%) | 8,602 (39.4%) | 8,414 (38.6%) | 3,630 (16.6%) |
(These times are i.e. 3:00:00-3:59:59. Note that Berlin times may be slightly less accurate than others based on the available data, but is still indicative overall)
Here’s a chart of finish times from the 2023 Boston, London and NYC Marathons (by Geeks On Feet). It gives you an idea of the spread of finish times (and check out the spikes in finishers before three hours, four hours and five hours!).
AGE ANALYSIS OF MANCHESTER MARATHON FINISHERS 2024
Let’s take a closer look at the 2024 Manchester Marathon, specifically relating to the age of finishers.
Why Manchester? It had a large number of finishers (21,825), the average finish times are in line with global marathon averages (4:13:51 overall), the percentage of sub-3 and over-5 finishers is consistent with other marathons, and we’ve actually got all the results for the race (which really helps!).
| AGE GROUP | MALE AVERAGE | FEMALE AVERAGE |
| Senior (18-34) | 4:02:47 | 4:34:45 |
| 35-39 | 3:57:11 | 4:34:44 |
| 40-49 | 3:59:56 | 4:38:23 |
| 50-59 | 4:13:02 | 4:47:37 |
| 60-69 | 4:30:53 | 5:00:37 |
| 70+ | 5:08:02 | 5:21:46 |
| Overall Average | 4:03:21 | 4:37:41 |
There’s a wide spread of finish times in each age group. For example, in the senior men’s category, the range was 2:29 to 7:41, while in the female 60-69 category the spread was 3:24 to 8:28. That’s more than five hours difference.
***
Based on all the data above, we came to the answer of 4:15 as a mathematical average marathon finish time. The most interesting data is how in almost all marathons, there are more finishers over five hours than under three hours. It makes marathons the greatest mass participation race there is, where world record holders can stand on the same start line as someone taking on their first race and hoping to finish before the cut off.
MARATHON PACE GUIDE
These are the paces you need to average during a marathon to finish in certain times. Based on your training, this should give you an idea of the time you might take to complete your marathon.
| MARATHON TIME | PACE PER MILE | PACE PER KM |
| 2:59 | 6:52 | 4:15 |
| 3:30 | 8:00 | 4:59 |
| 4:00 | 9:09 | 5:41 |
| 4:15 | 9:43 | 6:03 |
| 4:30 | 10:17 | 6:24 |
| 5:00 | 11:26 | 7:07 |
| 5:30 | 12:36 | 7:49 |
| 6:00 | 13:44 | 8:32 |
| 6:30 | 14:52 | 9:15 |
| 7:00 | 16:01 | 9:57 |
| 7:30 | 17:09 | 10:40 |
| 8:00 | 18:18 | 11:23 |
Lead image from BAA



















Running News
Ingebrigtsen Stars at World Athletics Indoor Championships 2025 – Plus All The Winners!
Sam Ruthe Is First 15-Year-Old To Run A Four-Minute Mile!
Eliud Kipchoge Will Run The 2025 Sydney Marathon!